RSI – indicator
The content of this article
The RSI (Relative Strength Index) is used in technical analysis primarily to determine whether a market is overbought or oversold. Based on this, buy or sell signals are created based on equilibrium commuting – that the price of assets fluctuates up and down.
RSI is usually used over the last 14 days but can also, on certain assets, be applied for shorter periods.
RSI = The ratio between average development during the positive trading days and average development during the negative trading days – during 14 days.
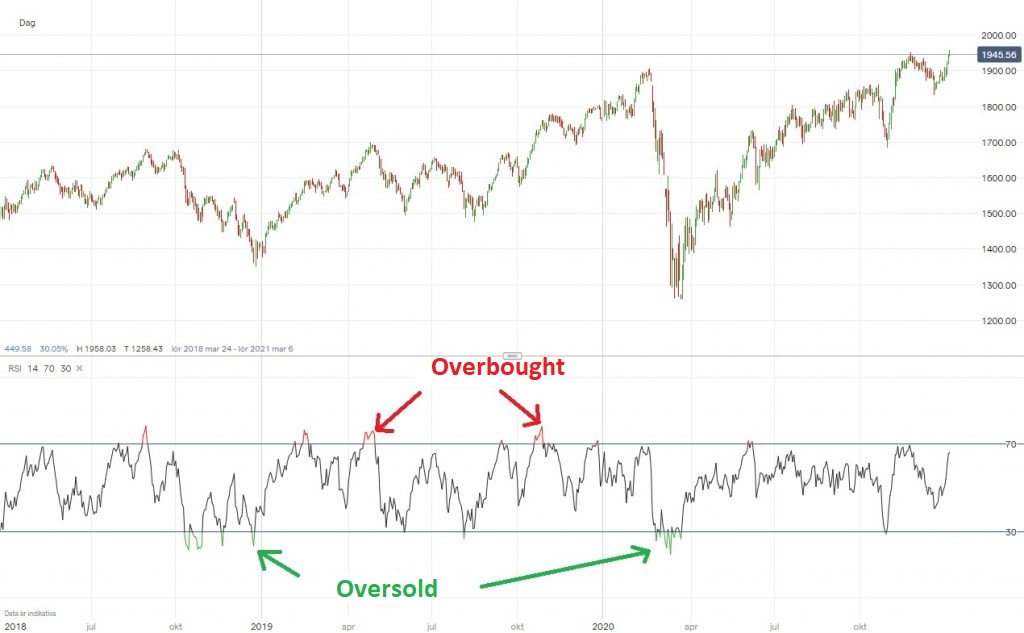
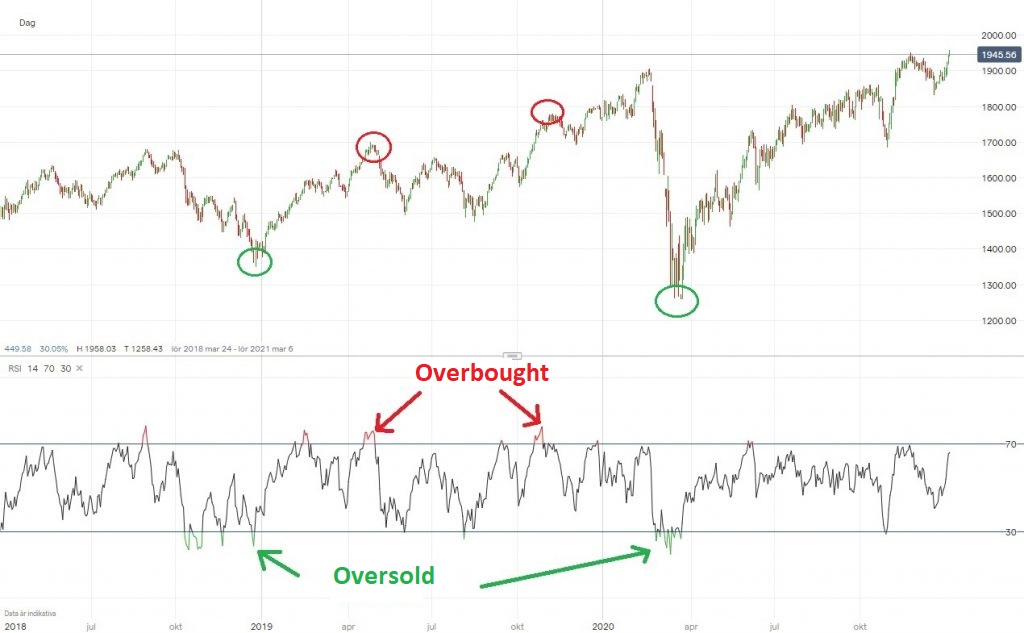
- Overbought = The price has gone up too much too fast which should result in a downward rebound.
- Oversold = The price has gone down too much too fast which should result in an upward rebound.
Mean Reversion
Using RSI to predict rebounds, and take short-term gains, is called “Mean Reversion”. The idea is simply to take short buy positions when the price is oversold and short sell positions when the price is overbought.
The basic idea of RSI-theory
In a sharply rising / falling market, the probability of a rebound will increase day by day. The question is not whether it will come – but when. There is a good chance that the market will be overbought or oversold, which provides an opportunity to take positions before the market gets a rebound.
Calculate RSI
When RSI is presented in trading programs, it is generally shown below the price graph. A bottom line is at 30 (oversold) and an upper at 70 (overbought). (See picture above)
RSI does not need to be calculated manually but can easily be viewed via trading software. The calculation, on the other hand, takes place in the following way.
RSI = 100 – (100/(1+RS))
RS = The average value of the days that the price was positive / The average value of the days that the price was negative.
Example
The first step is to calculate the RS. During a 14-day period, the price of the Astra A has developed as follows:
– Up – The price has been up for 10 days. This with an average of 10 points.
– Down – The price has gone down for 4 days. This with an average of 5 points.
RS = Average positive days/ Average negative days.
2 = 10/5
Now the RSI can be calculated:
RSI = 100 – (100/(1+2))
RSI = 100 – (100/3)
RSI = 100 – 33
RSI = 67
(How to trade using the RSI Indicator, IG)
Use the platform & app that IG.com offers for technical analysis. Their world class tools are completely free to use.
RSI levels – buy and sell signals
The RSI is displayed with a value of 0 to 100. Like several other tools, the RSI should be interpreted in the current direction of the trend. If the trend is upwards, then primarily buy signals should be sought and if the trend is downwards, sell signals should be sought.
Over 70
Signs that the stock has been overbought.
Below 30
Signs that the stock is oversold
A buy signal occurs if the RSI goes below 30 and later goes above this level. In other words, the RSI should pass 30 in an upward RSI trend.
In a similar way, a sales signal is created. In this case if the RSI has gone above 70 and then folds down and passes 70 in a downward RSI trend..
”False sales signals”
If a stock rises sharply for a long time, the RSI will repeatedly give sell signals and the RSI may remain above 70 for a long time. Those who sell will miss a large part of the sharp rise. There are a couple of ways to go about dealing with these false signals.
- The reboot method
RSI breaks 70 from above – which gives a sell signal. Now, however, no more signal can occur until the RSI has been “reset”, which means that the level has reached 50.
Even if the RSI should go above 70, and down again, this does not create any further sell signal. However, if the RSI has been down to 50, it “restarts”, after which ordinary sell signals are used.
- Avoiding speculative companies
The price of a speculative company/ startup is driven mainly by rumors, speculations and hopes – not by the company’s financial development. It is also often with these that large price changes can occur without any special reason. Applying RSI to these will be significantly more difficult than if only stocks from Large Cap or large stable companies on Mid Cap are used in the analysis.
Shop based on Swing rejections
To trade on the basis of safer indicators than just RSI, so-called Swing Rejections can be used. It is a technology that means that the RSI trend must be consolidated before a buying position arises.
An example is a stock that has been at RSI 25 and then gone up to 32. Since it means that RSI exceeds 30, it can be interpreted as a buy position. But instead of buying directly, the following development is awaited: If the RSI falls back, but without going below 30, and then reaches a new highest level, the trend is consolidated.
Failure Swing (divergens)
”Failure Swing” occurs when RSI is in an overbought or oversold area. In other words, over 70 or under 30.
Over 70 and the price is rising
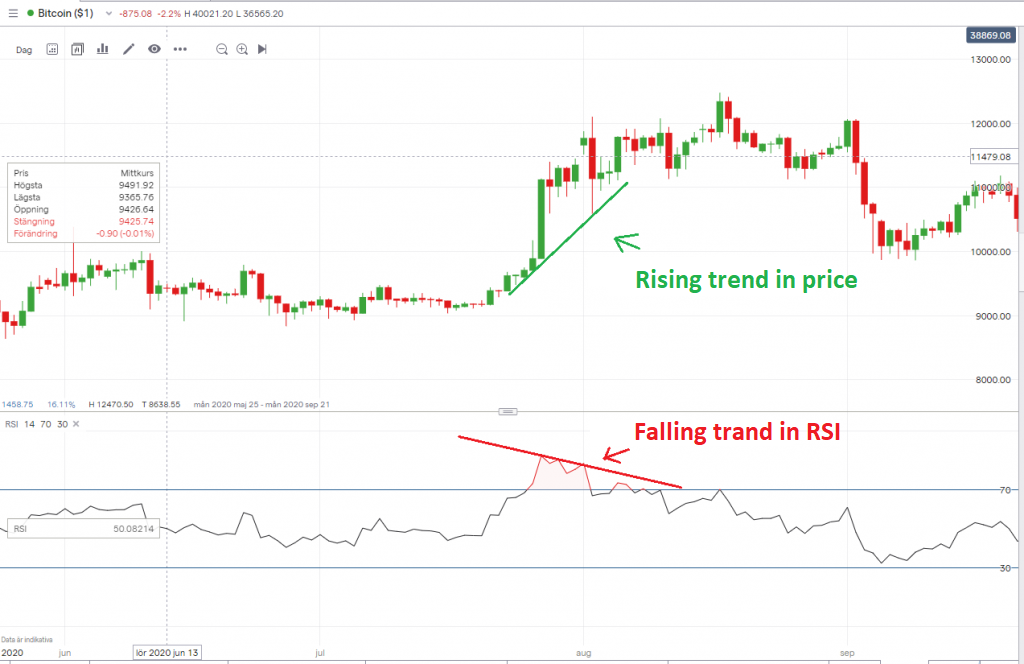
If the price trends upwards and creates new higher levels at the same time as the RSI trends downwards and does not reach higher levels, this is called a “Bearish failure swing”, it is a so-called divergence.
As the picture below shows, the price is rising and gaining new highs while the RSI has a downward trend. It is thus an example of Failure Swing.
Below 30 and the price drops
A similar situation arises if the price makes new lower levels, that means trends downwards while RSI trends upwards. This is called “Bullish divergence” or “Bullish failure swing”. It is simply a positive divergence.
Momentum – Shows strength
RSI is most often used to see levels where the equity/ security is overbought or oversold. But it is also possible to use RSI to demonstrate a strong trend. Even if the indicator indicates a buy or sell opportunity, the price continues in that direction and consolidates the trend.
RSI can often climb above 70 and stay there for a long time while the price continues to rise, that means it is trending sharply upwards.The reverse can happen when the RSI is below 30.
This is mainly used in markets with longer more stable trends and not in markets where short-term rebounds can be expected. You must therefore create an image of the stock or asset that you are analyzing. Does it have a tendency to fluctuate sharply or does it usually trend significantly when it starts to trend? Raw materials are an example of an asset that often trends significantly.
RSI and divergenses
Positive divergence – Bullish
If an RSI that is below 30 trends upwards at the same time as the price of the asset falls, a so-called positive divergence (also called bullish divergence) occurs.
Det kan därmed tyda på att kursen är i närheten av botten och kommer att vända uppåt. Ett köp kan ske med tanken att styrkan i prisets nedgång håller på att avta och att priset kan vända upp när som helst.
Negative divergence – Bearish
If an RSI is above 70 but trends downwards at the same time as the price of the asset rises, a so-called negative divergence occurs. It may be a sign a correction in the price should come soon. To take part in this expected development, either the stocks can be sold or a “short” position taken via securities that offer this type of trading.
Basic settings and adjustments
Basic settings
- 14 days
- RSI 70 Overbought
- RSI 30 Oversold
Depending on availability
Different assets have different levels of volatility. A high RSI in a specific asset does not have to indicate that the asset is overbought.
There is an advantage if you test yourself on the historical price and see when RSI has given indicators at overbought and oversold levels. What can be adjusted is precisely the number of days and the levels of overbought and oversold.
Bull or bear market
During a bullmarket, high RSI values can often occur without the asset being classified as overbought. At the same time, the downward turn can come relatively quickly. This is where skilled traders differ from amateurs. They can determine when supply should continue to trend and when it should balance equilibrium.
Example – RSI in practice
The following picture is from an example that explains the RSI with an example from the Swedish index OMX30 in 2020 from January to September. The upper part is the index and the lower part shows the RSI over this time.
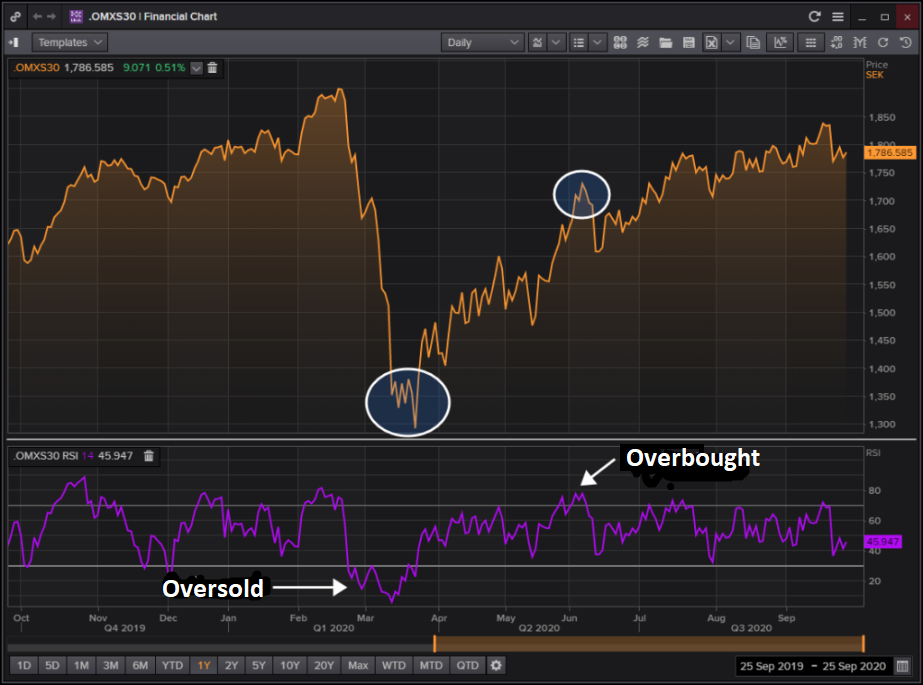
The corona pandemic created extreme selling pressure and RSI noted that the index was oversold. This is a classic opportunity where the market may have acted stronger than “necessary”, which creates a buying opportunity.
Gradually, the price recovers to finally be overbought in June. Confidence in regrowth increased so rapidly that the RSI demonstrated an overbought exchange rate. This can be seen as a sales opportunity.
Alternative RSI-methods
Connors RSI
Based on the RSI explained above, this is a more elaborate RSI with more parameters. Connor’s RSI shows the average of three different levels.
- RSI-value (as above)
- The length of the trend – How many days in a row the stock has had a positive or negative development.
- Change – The latest price change in percentile
RSI2
A shorter RSI with only an average value of 2 days.
- 2 day period
- RSI value 10 = oversold, ie. purchase mode
- RSI value 50 = overbought. i.e. sales mode
RSI Extreme
- Often shorter than 14 days, for example 9
- RSI value 95 or more, the holding is sold
- RSI value 5 or lower, purchase completed